Rankings
Port Data
| Rank | Port Name | City | Type of Freight | TEUs 2022 | TEUs 2021 | % Change | Freight Tonnage (metric tons) |
|---|---|---|---|---|---|---|---|
| 1 | Port of Los Angeles | Los Angeles | container, break bulk, dry bulk, liquid bulk, automotive, heavy lift, special project cargo, refrigerated, passenger | 9,911,159 | 10,677,610 | -7.2% | 219,000,000* |
| 2 | Port of New York and New Jersey | New York | container, break bulk, dry bulk, liquid bulk, automotive, heavy lift, special project cargo, refrigerated, passenger | 9,493,664 | 8,985,929 | 5.7% | |
| 3 | Port of Long Beach | Long Beach, Calif. | container, break bulk, dry bulk, liquid bulk, automotive, heavy lift, special project cargo, refrigerated, passenger | 9,133,657 | 9,384,368 | -2.7% | 193,354,062 |
| 4 | Port of Savannah | Savannah, Ga. | container, break bulk, heavy lift, automobile, refrigerated | 5,892,131 | 5,613,163 | 5.0% | 38,459,904 |
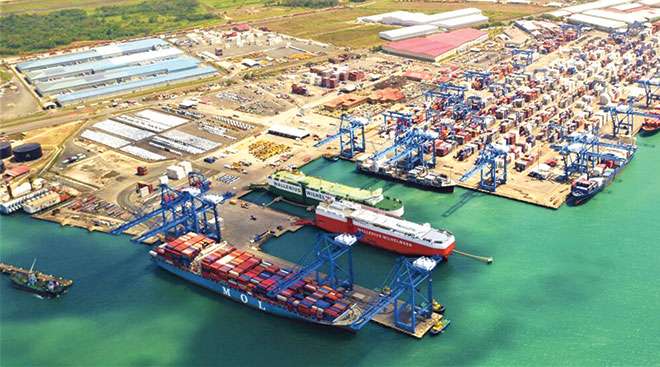
| 5 | Ports of Colon, Cristobal and Manzanillo | Colón, Panama | container, liquid bulk, dry bulk, passenger, transshipping | 5,058,556 | 4,915,975 | 2.9% | |
| 6 | Port Houston | Houston | container, break bulk, dry bulk, liquid bulk | 3,974,901 | 3,453,226 | 15.1% | 49,950,465 |
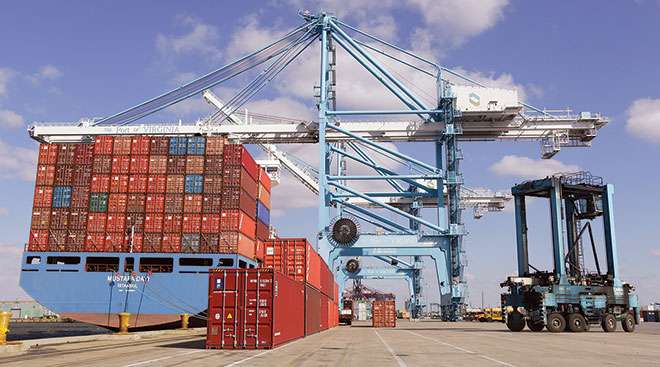
| 7 | Port of Virginia | Norfolk, Va. | container, break bulk, dry bulk, liquid bulk, automobile | 3,703,231 | 3,522,834 | 5.1% | 59,398,828 |
| 8 | Port of Vancouver | Vancouver, British Columbia | container, break bulk, dry bulk, liquid bulk, automobile, special project cargo, passenger | 3,557,294 | 3,678,952 | -3.3% | 142,469,186 |
| 9 | Port of Manzanillo | Manzanillo, Colima, Mexico | container, dry bulk, liquid bulk | 3,473,852 | 3,371,438 | 3.0% | 34,434,272 |
| 10 | Northwest Seaport Alliance | Seattle and Tacoma, Wash. | container, break bulk, liquid bulk, dry bulk, automobile, heavy lift, special project cargo, refrigerated, passenger, air cargo | 3,384,018 | 3,736,206 | -9.4% | 24,551,174 |
| 11 | Port of Balboa/PSA Panama International Terminal | Panama Int'l Terminals, Panama | container, transshipping | 3,347,861 | 3,561,432 | -6.0% | |
| 12 | Port of Charleston | Charleston, S.C. | container, break bulk, dry bulk, automobile, refrigerated | 2,792,313 | 2,751,442 | 1.5% | |
| 13 | Port of Oakland | Oakland, Calif. | container | 2,337,607 | 2,448,243 | -4.5% | |
| 14 | Port of Kingston | Kingston, Jamaica | container, heavy lift, liquid bulk | 2,137,500 | 1,975,401 | 8.2% | |
| 15 | Port of Montreal | Montreal | container, break bulk, dry bulk, liquid bulk, passenger | 1,722,704 | 1,728,114 | -0.3% | 35,997,337 |
| 16 | Port of Lázaro Cárdenas | Lázaro Cárdenas, Michoacán, Mexico | container, break bulk, dry bulk, liquid bulk, transshipping | 1,700,000 | 1,686,076 | 0.8% | |
| 17 | Port of Freeport | Freeport, Bahamas | container, passenger | 1,574,200 | 1,642,780 | -4.2% | |
| 18 | Port of Caucedo | Caucedo, Dominican Republic | container, refrigerated, transshipping | 1,406,500 | 1,250,000 | 12.5% | |
| 19 | Port of San Juan | San Juan, Puerto Rico | container | 1,398,600 | 1,438,738 | -2.8% | |
| 20 | Port of Jacksonville^ | Jacksonville, Fla. | container, break bulk, dry bulk, liquid bulk, automobile, heavy lift, refrigerated | 1,298,132 | 1,407,310 | -7.8% | 9,101,666 |
| 21 | Port Miami^ | Miami | container, passenger | 1,197,663 | 1,254,062 | -4.5% | 9,267,587 |
| 22 | Moín Container Terminal | Límon, Costa Rica | container | 1,182,854 | 1,319,372 | -10.3% | |
| 23 | Port Everglades | Broward County, Fla. | container, break bulk, dry bulk, liquid bulk, passenger | 1,107,546 | 1,038,179 | 6.7% | 24,129,601 |
| 24 | Port of Baltimore | Baltimore | container, break bulk, dry bulk, liquid bulk, automobile, refrigerated, passenger | 1,069,421 | 1,022,683 | 4.6% | 10,307,241 |
| 25 | Port of Prince Rupert | Prince Rupert, British Columbia | container, break bulk, dry bulk, liquid bulk, special project cargo, passenger | 1,035,639 | 1,054,836 | -1.8% | 24,593,720 |
| NOTE: Data for the ports of Kingston, Freeport, Caucedo and San Juan are via PortEconomics. Data for the Port of Lázaro Cárdenas is via the American Journal of Transportation. All other data is via port authorities. * Freight tonnage for the Port of Los Angeles is for fiscal year 2021-22, ended June 30, 2022. ^ Data for the Port of Jacksonville and Port Miami is for fiscal year 2021-22, ended Sept. 30, 2022. |
|||||||
Global Supply Chains Back to Normal, N.Y. Fed Says
Global supply chains have returned to normal, the Federal Reserve Bank of New York said, almost three years after COVID-19 was declared a pandemic.
March 6, 2023French Shipping Giant CMA CGM Warns Demand Is Falling
French shipping giant CMA CGM SA warned of a steep drop in demand so far this year, extending a slump that led to a more than halving of quarterly profit.
March 6, 2023Supply Chain Envoy Says Automating Ports Doesn’t Have to Cost Jobs
The White House’s supply chain envoy said the ports and logistics industry must move toward automation, a sticking point in protracted contract talks between U.S. West Coast dockworkers and their employers.
March 1, 2023USPS Buys Electric Vans, Charging Stations in Bulk
WASHINGTON — The U.S. Postal Service is buying 9,250 Ford Motor Co. electric vans and 14,000 charging stations as part of a move to switch its fleet to electric vehicles.
March 1, 2023Supply Chains Have Healed, Yet Their Mark on Inflation to Endure
Supply chains across the world are healing up almost as fast as they broke down. That doesn’t mean the pressure they’re exerting on inflation will disappear as quickly.
February 27, 2023FedEx Pilots Plan Strike Authorization Vote as Labor Talks Stall
FedEx Corp. pilots are inching closer to a potential strike as negotiations stall on a new labor agreement.
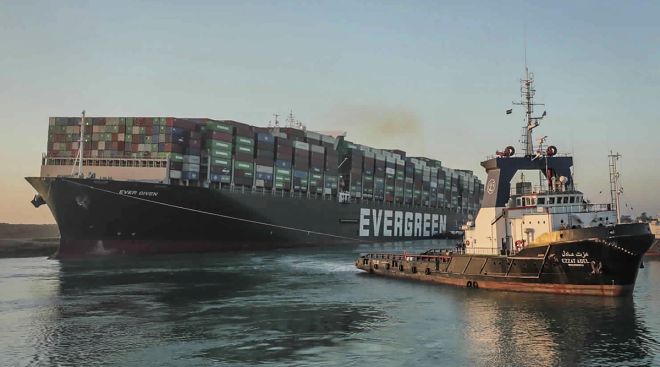
February 23, 2023Maersk Suing Evergreen Over 2021 Suez Canal Blockage
Shipping giant A.P. Moeller-Maersk said in an email to The Associated Press that it filed a claim against Evergreen Marine Corp., the vessel’s Japanese owner and its German technical manager in the Danish Maritime and Commercial High Court.
February 13, 2023Maersk Sees Global Trade Contracting as Much as 2.5% in 2023
A.P. Moller-Maersk A/S said “muted” economic growth is set to push the world’s container shipping volumes down by as much as 2.5% this year.
February 8, 2023Thousands of CSX Workers First to Get Paid Sick Leave
OMAHA, Neb. — Several thousand workers at CSX will soon get one of the things that pushed the U.S. railroad industry to the brink of a strike last fall: paid sick time.
February 8, 2023Supply Chains Must Change, Says Maersk’s Ditlev Blicher
Increasing volatility in global supply chains means shipping lines must undergo a radical restructuring to survive, according to A.P. Moller-Maersk A/S.
February 8, 2023

