Top 100 Private | Food Service | Grocery | Beverage | Petroleum/Chemical | Industrial Gases | Agriculture/Food Processing | Wholesale/Retail | Manufacturing
Equipment Rental | Building Materials | Waste Management | Paper/Office Products | Construction | Health Care | Uniform Rental | Media & Entertainment
| Rank This Year | Rank Last Year | Company | Tractors | Trucks | Pickups/ Cargo Vans | Trailers | Annual Revenue |
|---|---|---|---|---|---|---|---|
| 1 | 1 | PepsiCo Inc. |
9,950 | 14,304 | - | 16,102 | $63.1 billion |
| 2 | 2 | Sysco Corp. |
8,391 | 1,404 | 355 | 10,320 | $48.7 billion |
| 3 | 3 | Wal-Mart Stores |
6,277 | 199 | - | 66,191 | $482.1 billion |
| 4 | 4 | Coca-Cola Co. |
5,664 | 1,054 | - | 7,465 | $44.3 billion |
| 5 | 5 | Halliburton Co. |
5,637 | 1,160 | - | 9,509 | $23.6 billion |
| 6 | 6 | U.S. Foods |
5,242 | 354 | - | 6,530 | $23.0 billion |
| 7 | 10 | Schlumberger Limited |
3,994 | 1,314 | - | 4,770 | $35.5 billion |
| 8 | 8 | Reyes Holdings |
3,936 | 616 | 536 | 4,782 | $24.0 billion |
| 9 | 7 | Agrium Inc. |
3,930 | 2,315 | 7,457 | 6,297 | $14.8 billion |
| 10 | 9 | McLane Co. |
3,837 | 305 | 9 | 5,283 | $48.0 billion |
| 11 | 11 | C & J Energy Services |
2,970 | 1,661 | - | 4,580 | $1.7 billion |
| 12 | 13 | Performance Food Group |
2,814 | 132 | - | 3,500 | $11.7 billion |
| 13 | 15 | Dr Pepper Snapple Group |
2,293 | 87 | 1,165 | 2,902 | $6.4 billion |
| 14 | 16 | Baker Hughes |
2,282 | 1,813 | - | 2,856 | $15.7 billion |
| 15 | 18 | Dean Foods Co. |
2,135 | 2,752 | 422 | 5,239 | $8.1 billion |
| 16 | 12 | Tyson Foods |
2,122 | 59 | - | 6,105 | $40.6 billion |
| 17 | Femsa Logistica |
1,920 | - | - | 2,308 | $0.8 billion |
|
| 18 | 19 | Gordon Food Service |
1,787 | 36 | - | 2,453 | - |
| 19 | 70 | American Air Liquide Holdings |
1,754 | 4,117 | - | 3,126 | - |
| 20 | 21 | Basic Energy Services |
1,620 | 386 | - | 1,819 | $0.8 billion |
| 21 | 22 | Kroger Co. |
1,557 | 35 | - | 5,826 | $109.8 billion |
| 22 | 26 | Albertsons |
1,497 | - | - | 6,021 | - |
| 23 | 23 | United Rentals Inc. |
1,420 | 2,204 | - | 1,484 | $5.8 billion |
| 24 | 14 | CHS Inc. |
1,376 | 2,148 | - | 2,154 | $34.6 billion |
| 25 | 17 | Clean Harbors Inc. |
1,347 | 4,662 | - | 3,109 | $3.3 billion |
| 26 | 25 | Gibson Energy Inc. |
1,300 | - | - | 2,500 | $5.6 billion |
| 27 | 29 | Dot Foods |
1,290 | 4 | 17 | 1,970 | - |
| 28 | 44 | Calfrac Well Services |
1,270 | 568 | - | 2,097 | $1.5 billion |
| 29 | 28 | Helena Chemical Co. |
1,172 | 1,932 | - | 2,575 | - |
| 30 | 20 | Weatherford International |
1,136 | 605 | - | 3,297 | $9.4 billion |
| 31 | 30 | Praxair Inc. |
1,115 | 1,787 | - | 3,677 | $10.8 billion |
| 32 | 31 | Prairie Farms Dairy |
1,104 | 1,386 | 234 | 2,968 | - |
| 33 | 32 | Pilot Flying J Inc. |
1,032 | - | - | 1,314 | - |
| 34 | 41 | Darling Ingredients |
1,016 | 682 | 355 | 4,141 | $3.4 billion |
| 35 | 35 | Builders FirstSource Inc. |
990 | 2,541 | - | 1,693 | $6.1 billion |
| 35 | 34 | Plains All American Pipeline |
990 | - | - | 1,930 | $23.2 billion |
| 37 | 27 | Key Energy Services |
946 | 998 | - | 949 | $0.8 billion |
| 38 | 39 | Ben E. Keith Co. |
941 | 46 | - | 1,170 | - |
| 39 | 38 | Sunbelt Rentals |
919 | 1,972 | - | 1,058 | $3.3 billion |
| 40 | 33 | Cemex USA |
902 | 3,968 | - | 1,416 | $3.9 billion |
| 41 | 48 | Ahold Delhaize Group |
885 | 661 | - | 3,992 | - |
| 42 | 87 | Coca-Cola Bottling United |
806 | 424 | - | 962 | - |
| 42 | 37 | Veritiv Corp. |
806 | 106 | 117 | 1,274 | $8.7 billion |
| 44 | Southern Glazer's Wine $amp;amp; Spirits |
802 | 2,111 | - | 1,276 | - | |
| 45 | 60 | Food Services of America |
772 | 55 | - | 741 | - |
| 46 | 43 | Walgreen Co. |
754 | 6 | - | 1,848 | $103.4 billion |
| 47 | 52 | United Natural Foods |
747 | 2 | - | 913 | $8.2 billion |
| 48 | 54 | Core-Mark Holding Co. |
745 | 98 | - | 911 | $11.1 billion |
| 49 | 36 | Nestle USA |
735 | 3,205 | - | 1,527 | $9.7 billion |
| 49 | 47 | Univar Inc. |
735 | 97 | 65 | 1,761 | - |
| 51 | 45 | Linde North America |
733 | 2,270 | - | 1,899 | $2.0 billion |
| 52 | 46 | Kellogg Co. |
710 | 60 | - | 1,153 | $13.5 billion |
| 53 | 53 | Ashley Furniture Industries |
709 | 1 | 10 | 3,400 | - |
| 54 | 42 | Shaw Industries Group |
697 | 55 | 238 | 3,233 | - |
| 55 | 65 | Quikrete Companies |
685 | 16 | - | 883 | - |
| 56 | 56 | Mondelez International |
680 | 230 | 50 | 780 | $29.6 billion |
| 57 | 61 | ABC Supply Co. |
633 | 2,400 | 254 | 898 | - |
| 58 | 73 | Energy Transfer Partners |
629 | 120 | - | 740 | $34.3 billion |
| 59 | 55 | Advanced Drainage Systems |
625 | 0 | - | 1,100 | - |
| 60 | 50 | Lowe's Companies Inc. |
624 | 72 | - | 640 | $59.1 billion |
| 61 | 72 | Cudd Energy Services |
619 | 183 | - | 958 | - |
| 62 | Brenntag North America |
612 | 89 | - | 1,513 | $11.5 billion |
|
| 63 | 64 | Maxim Crane Works |
608 | 0 | - | 985 | - |
| 63 | 51 | Nuverra Environmental Solutions |
608 | 223 | - | 873 | $0.4 billion |
| 65 | 63 | Archer Daniels Midland |
602 | 87 | - | 1,702 | $67.7 billion |
| 66 | 58 | Love's Travel Stops |
585 | 2,048 | - | 1,474 | - |
| 67 | 74 | Oldcastle Inc. |
585 | 2,048 | - | 1,474 | - |
| 68 | 62 | Golden State Foods |
580 | 45 | - | 794 | $7.0 billion |
| 69 | 86 | Sherwin-Williams Co. |
571 | 1 | - | 1,548 | $11.3 billion |
| 70 | 59 | JBS USA Holdings |
569 | 0 | - | 1,302 | - |
| 71 | 48 | Perdue Farms Inc. |
567 | 39 | 582 | 1,627 | - |
| 72 | 57 | Publix Super Markets |
562 | 18 | - | 2,696 | $32.4 billion |
| 73 | 69 | MDU Resources Group |
553 | 1,747 | - | 1,718 | $4.2 billion |
| 74 | 40 | Air Products Inc. |
550 | 95 | 420 | 2,000 | $9.9 billion |
| 75 | 80 | SE Independent Delivery Services |
545 | 175 | - | 1,401 | - |
| 76 | 67 | Pilot Thomas Logistics |
542 | 826 | - | 870 | - |
| 77 | 68 | C&S Wholesale Grocers |
541 | 0 | - | 1,434 | $30.0 billion |
| 78 | 76 | Shamrock Foods Co. |
539 | 61 | 75 | 757 | - |
| 79 | 74 | H.E.B. Grocery Co. |
534 | 9 | - | 2,208 | - |
| 80 | 71 | Bunzl Distribution USA |
511 | 66 | 52 | 920 | - |
| 81 | 80 | Foster Farms |
507 | 134 | - | 1,345 | - |
| 82 | Stericycle Inc. |
506 | 3,544 | - | 1,923 | $3.0 billion |
|
| 83 | Swire Coca-Cola USA |
496 | 218 | - | 615 | - | |
| 84 | 94 | KeHE Distributors |
470 | 94 | 40 | 686 | - |
| 85 | 79 | Ace Hardware Corp. |
469 | 1 | - | 1,413 | $4.7 billion |
| 85 | 89 | Sanderson Farms Inc. |
469 | 5 | - | 654 | $2.8 billion |
| 87 | 78 | Pepsi Bottling Ventures |
468 | 146 | 199 | 534 | - |
| 88 | Anheuser-Busch LLC |
452 | 99 | - | 364 | - | |
| 89 | 83 | Supervalu Inc. |
440 | 4 | - | 1,815 | $17.5 billion |
| 90 | 83 | The H.T. Hackney Co. |
438 | 170 | - | 578 | - |
| 91 | 88 | Mohawk Industries |
420 | 138 | - | 2,217 | $8.6 billion |
| 92 | 91 | BlueLinx Holdings |
414 | 14 | - | 644 | $1.9 billion |
| 93 | 98 | J.R. Simplot Co. |
408 | 876 | - | 1,485 | - |
| 93 | 96 | Maines Paper & Food Service |
408 | 58 | - | 506 | $4.0 billion |
| 95 | Select Energy Services |
407 | 193 | - | 1,050 | - | |
| 96 | 83 | Bimbo Bakeries USA |
399 | 3,806 | - | 895 | - |
| 97 | 92 | Hertz Equipment Rental Corp. |
397 | 748 | - | 431 | $1.5 billion |
| 98 | 82 | Sentinel Transportation |
393 | 1 | - | 815 | - |
| 99 | Mobile Mini |
389 | 178 | - | 428 | $0.5 billion |
|
| 100 | 93 | Valley Proteins Inc. |
385 | 94 | 40 | 1,075 | - |
The Top 100 Private Carriers Companies on this list operate their own trucks to carry freight and are ranked on the basis of the total number of highway tractors in the fleet. To be included in the Top 100 list, please send contact information to tteditor@ttnews.com. We will contact you via phone or e-mail to get information about your company prior to publication of the next Top 100 list.
On the Bubble
Colorado Files Lawsuit to Block Kroger-Albertsons Merger
Colorado sued to block Kroger Co.’s $24.6 billion acquisition of Albertsons Cos. in court Feb. 14, becoming the second state to challenge the deal.
Kroger CFO Departs During Uncertainty on Albertsons Merger
Kroger Co. said Feb. 5 that its chief financial officer is leaving for another company as the supermarket operator waits for regulators’ ruling on its proposed merger with Albertsons Cos.
Walmart Adds Stock Grants as Perk in Manager-Retainment Push
NEW YORK — Walmart is further sweetening the perks for its U.S. store managers as it seeks to retain its leaders and attract new ones in a still competitive job market.
United Rentals Q4 Profit Rises 6.3% on Broad Demand Strength
United Rentals reported net profit of $679 million in the fourth quarter of 2023, a 6.3% year-over-year increase compared with $639 million in the year-ago period.
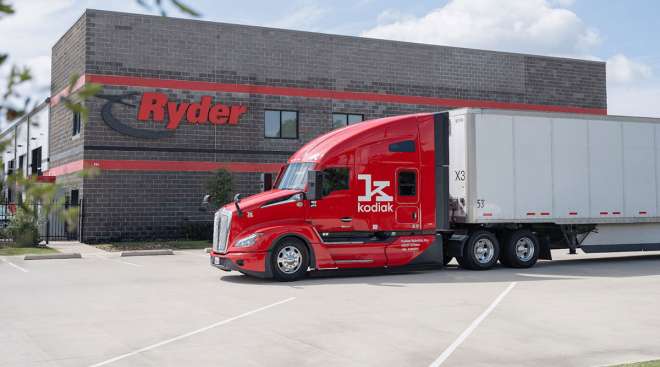
Kodiak Opens Truck Port at Ryder Facility in Houston
Kodiak Robotics opened a second truck port for its autonomous semis at a Ryder System Inc. fleet maintenance facility in Houston, the companies said Jan. 23.
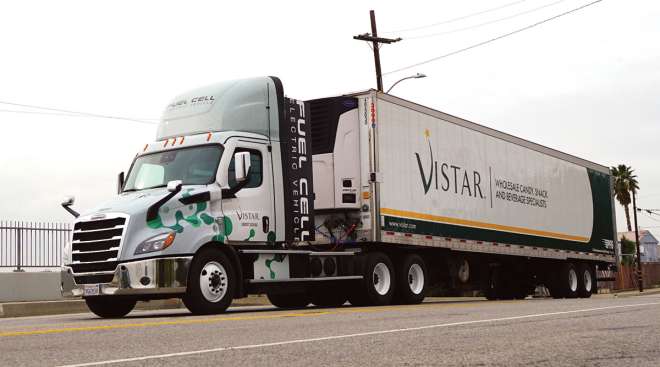
Hyzon Sends Four Hydrogen FCEV Trucks to PFG in California
Hyzon delivered four trucks to Performance Food Group’s Vistar facility in Fontana, Calif., the first deliveries of the hydrogen fuel cell electric vehicle to its largest U.S. customer.
ADM Shares Plunge After Accounting Probe Places CFO on Leave
Archer-Daniels-Midland Co. plunged after the U.S. agricultural trading giant suspended its CFO and cut its earnings outlook pending an investigation into its accounting practices.
Red Sea Attacks Disrupt Food Trade, Risk Higher Grocery Costs
Chaos in the Red Sea is starting to disrupt shipments of produce from coffee to fruit — and threatening to halt a slowdown in food inflation that brought some relief to strained consumers.
January 19, 2024Walmart Boosts Managers’ Base Pay, Redesigns Bonus System
NEW YORK — Walmart Inc. is raising the starting base pay for store managers, while redesigning its bonus plan that will put more of an emphasis on profits for these leaders.
Washington State Sues to Block Kroger-Albertsons Merger
SEATTLE — Washington state Attorney General Bob Ferguson on Jan. 15 sued to block the proposed merger of Kroger and Albertsons, two of the nation’s largest grocery chains.
January 16, 2024


